Campaign Analytics
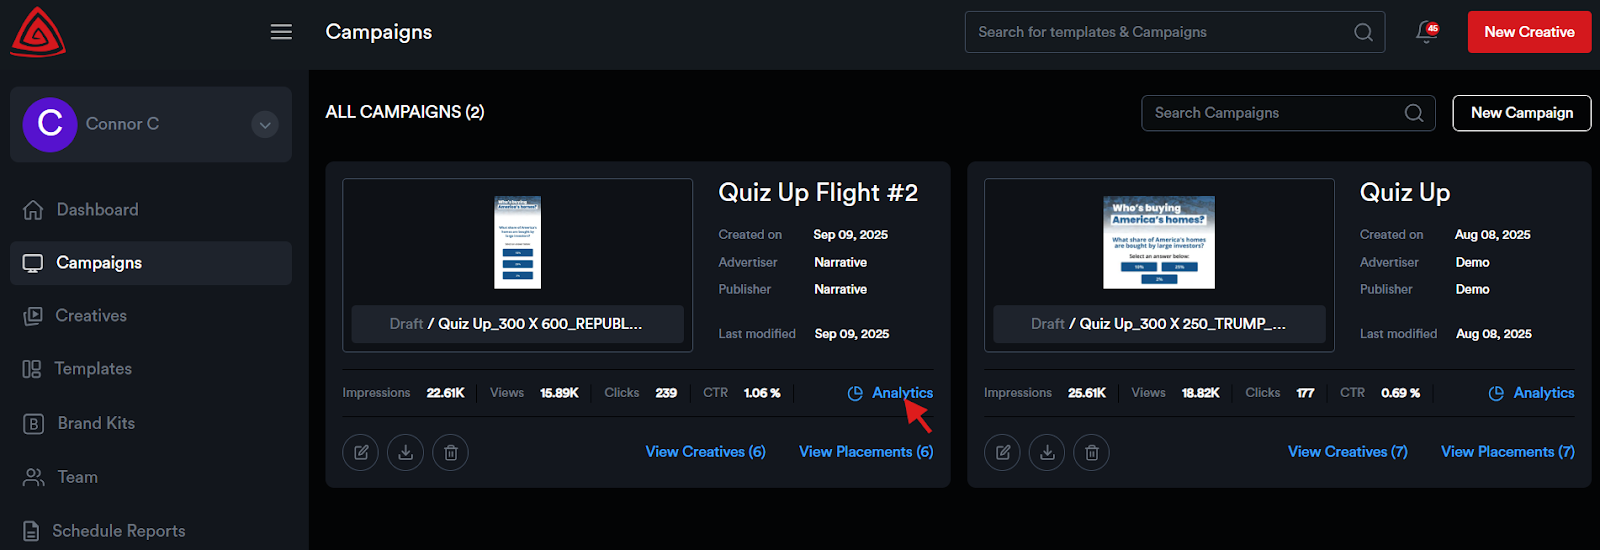
To view analytics for a Campaign:
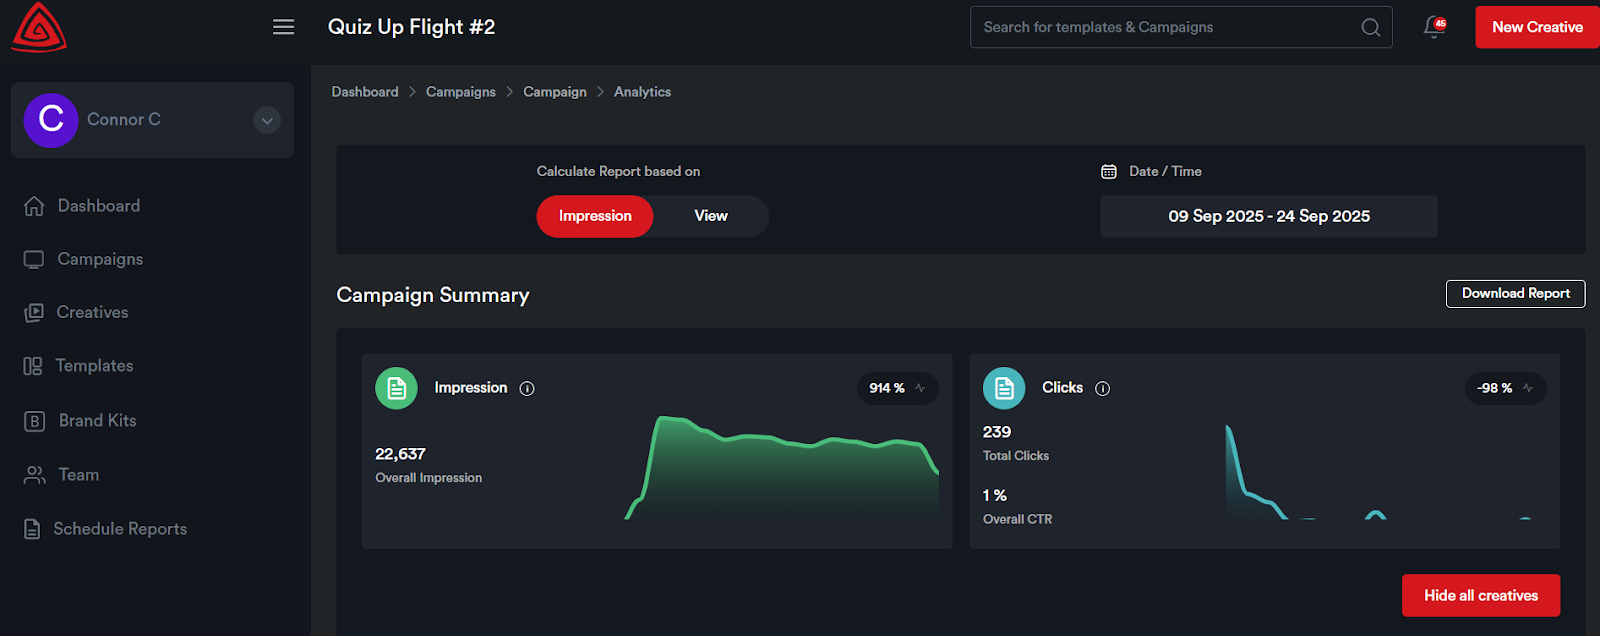
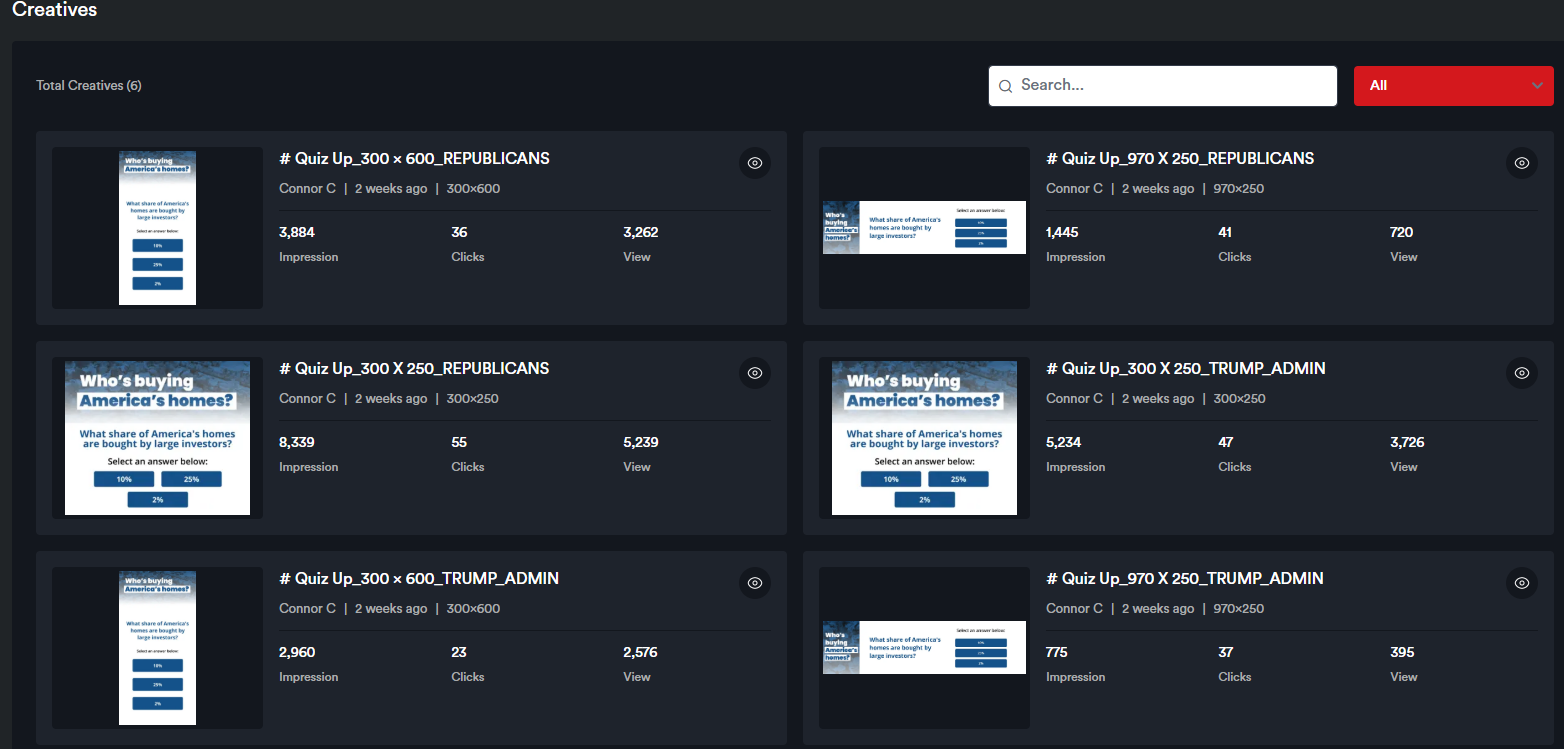
You’ll see a campaign summary along with individual creative analytics displayed on each creative card.
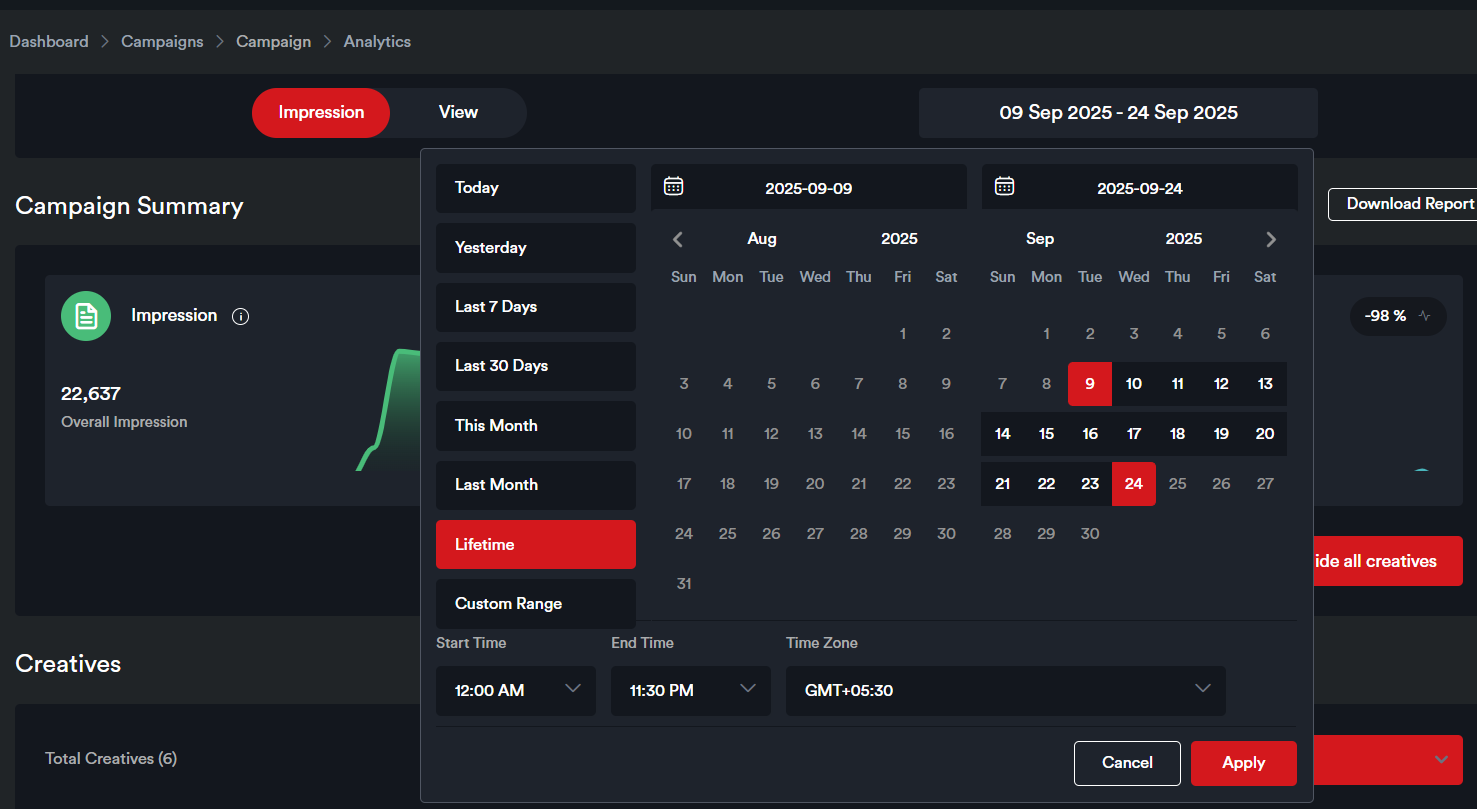
The default date range for which the Analytics are displayed on this page is the last seven days. The date range can be modified by selecting from the date range picker.
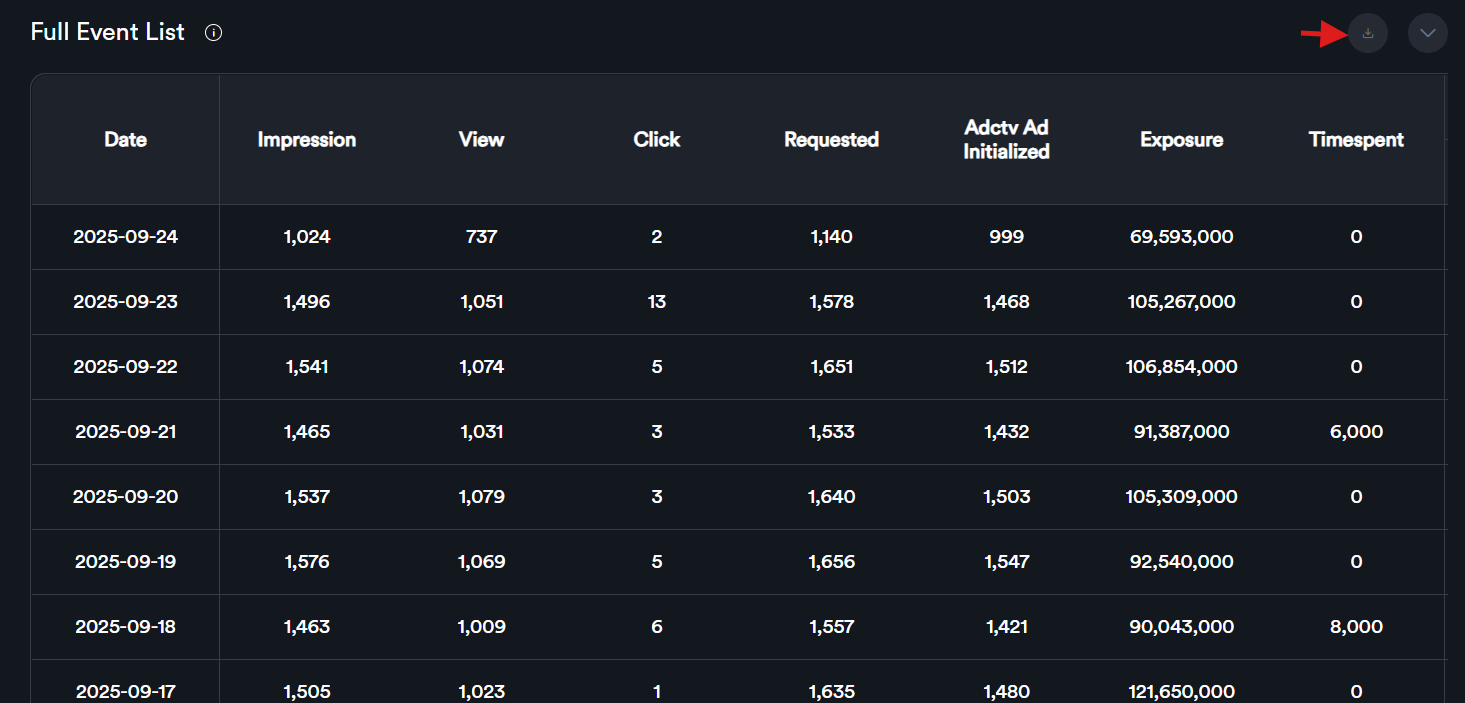
Scroll down to the ‘Full Event List’ table to view data for individual metrics.
To download the report, click the Download button to export the data in Excel format.
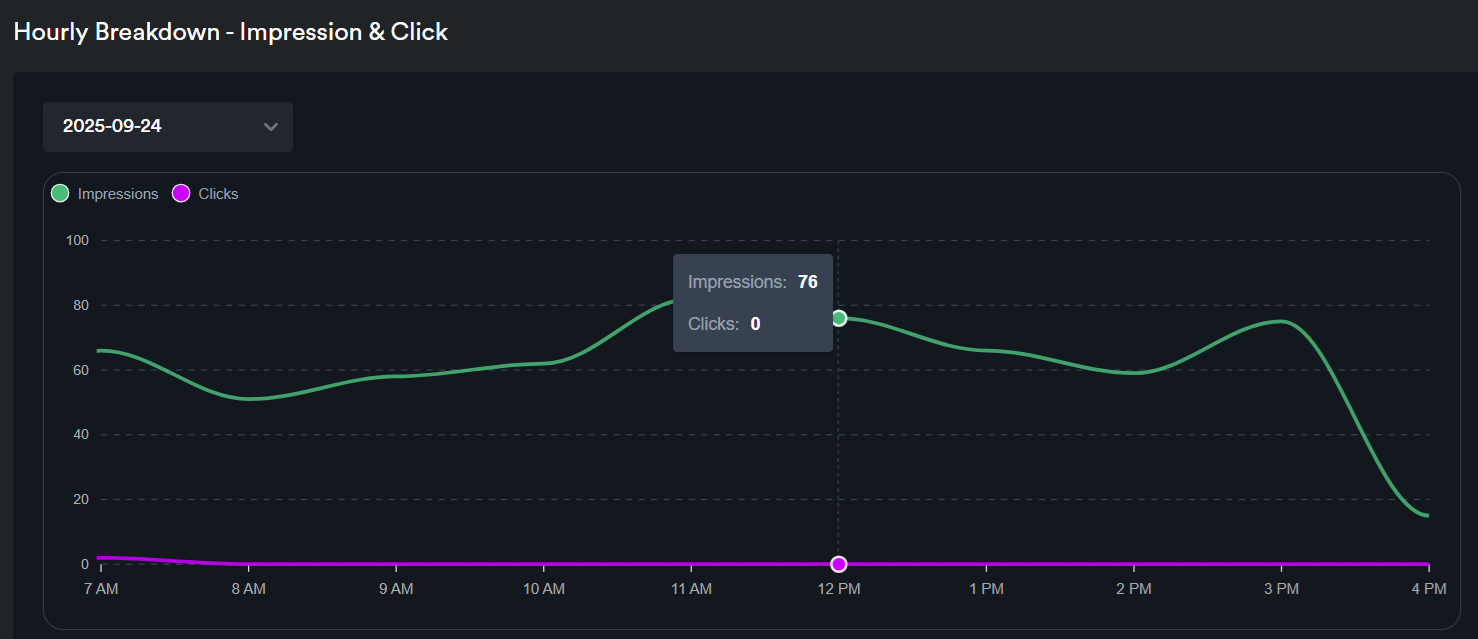
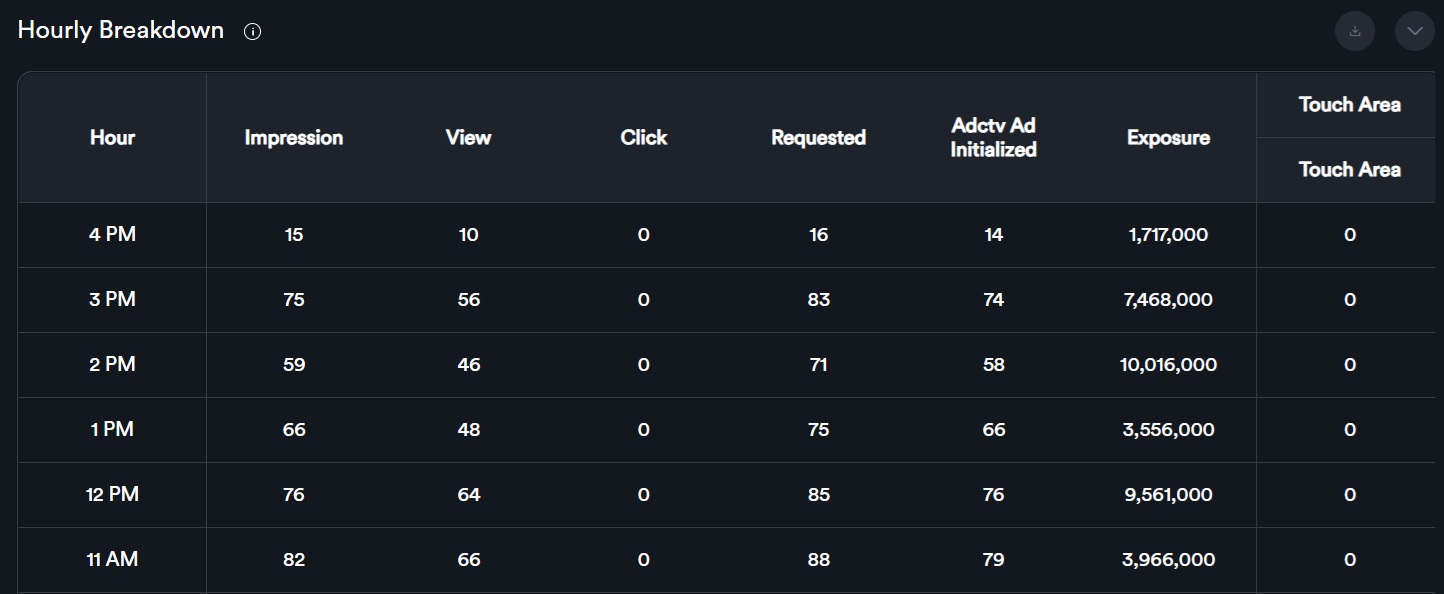
If you scroll down, you will see the hourly breakdown statistics displayed both as a graph and in a table. Hourly reports are available only on a per-day basis.